Google Ads Landing Page Experiments For Local Businesses
When you have a large Google Ads account advertising a large number of business locations, some of which are near each other, it can be challenging to properly promote each location as a group, while emphasizing the most relevant businesses to a user’s query and location. Your landing page has a lot of work to do. Generally, you’ll want it to display the appropriate locations, include an interactive map, have prominent call-to-actions that lead to measurable conversions, and have text that reinforces the locale the user is located in or searching about. It takes testing and iterating to find a template that works best for your campaigns. And after putting in the work to create a landing page variation, you’ll want to find results as quickly as possible. This isn’t as straightforward as it used to be in Google Ads; auctions and ad inventory are mixed across various search results pages and platforms. It’s possible that a lot of the traffic on your ads never actually sees your landing page.
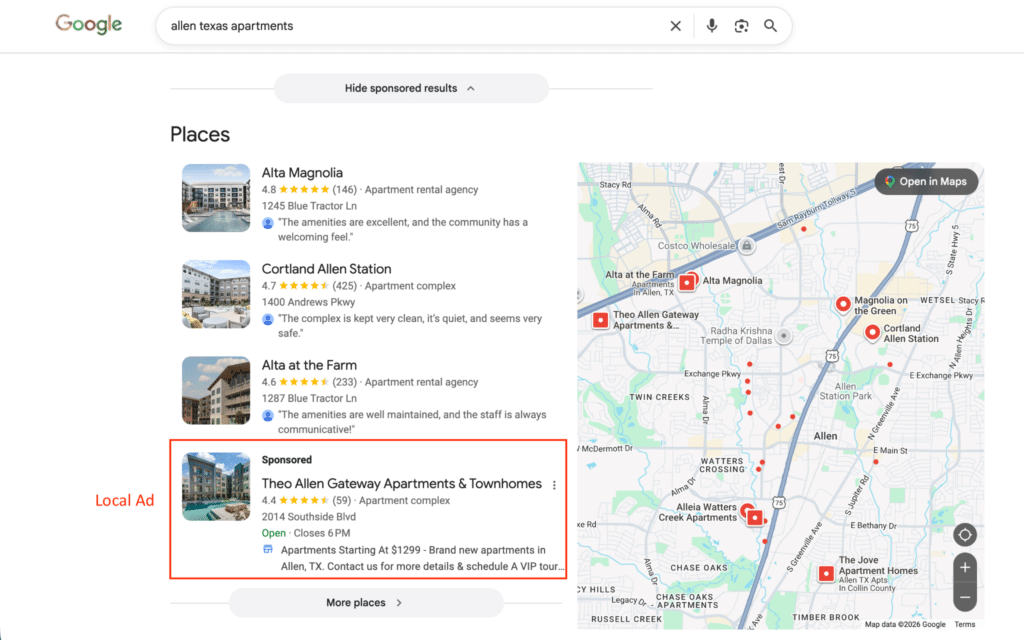
Local Ads and Click Types
Clicks on your Google ads do not necessarily lead to your website. In fact for certain account types, most of the clicks on your ads won’t send a user directly to your website. Segmenting your data by “click type” in Google Ads, reveals how much ad traffic is potentially reaching your website. For example, segmenting by click type in an account running search and display campaigns for local businesses might reveal numbers similar to these:
| Click Type | Clicks | Cost/Conv |
| App store | 0 | $0 |
| Cards | 0 | $0 |
| Driving direction | 3,561 | $91 |
| End cap | 0 | $0 |
| Get location details | 18,312 | $26 |
| Headline | 19,934 | $34 |
| Image | 45 | $135 |
| Manually dialed phone calls | 0 | $0 |
| Maps Pin Clicks | 63 | $19 |
| Mobile clicks-to-call | 5,859 | $5 |
| Show nearby locations | 0 | $0 |
| Sitelink | 2,220 | $37 |
| Website | 7 | $0 |
| Total | 50,000 | $25 |
In this example, less than half the clicks lead directly to your website; more than half are clicks originating from local listings. The different click types also have different average cost per conversion values. Clicks for driving directions have a much higher cost per conversion than clicks-to-call or clicks on a headline. This example highlights several important considerations with the way Google Ads operates:
- A lot of the conversion activity may be effectively outside your control. Updating landing pages may only impact a fraction of your overall paid click traffic.
- Bidding options don’t give you control over which types of ads are served, even if you are using manual bidding or setting targets with smart bidding. While Google has “advanced bid adjustments” for calls, it does not provide options for controlling how frequently your local listings ads show compared to more traditional text ads. In the example above, even though “driving directions” have a high cost per conversion, you can’t bid lower on this type of click. You also can’t directly boost traditional text ads compared to ads that might show up amongst the local business pack listings. Google is using its own criteria to price these various types of clicks, mashing together different ad inventory that compete in separate auctions.
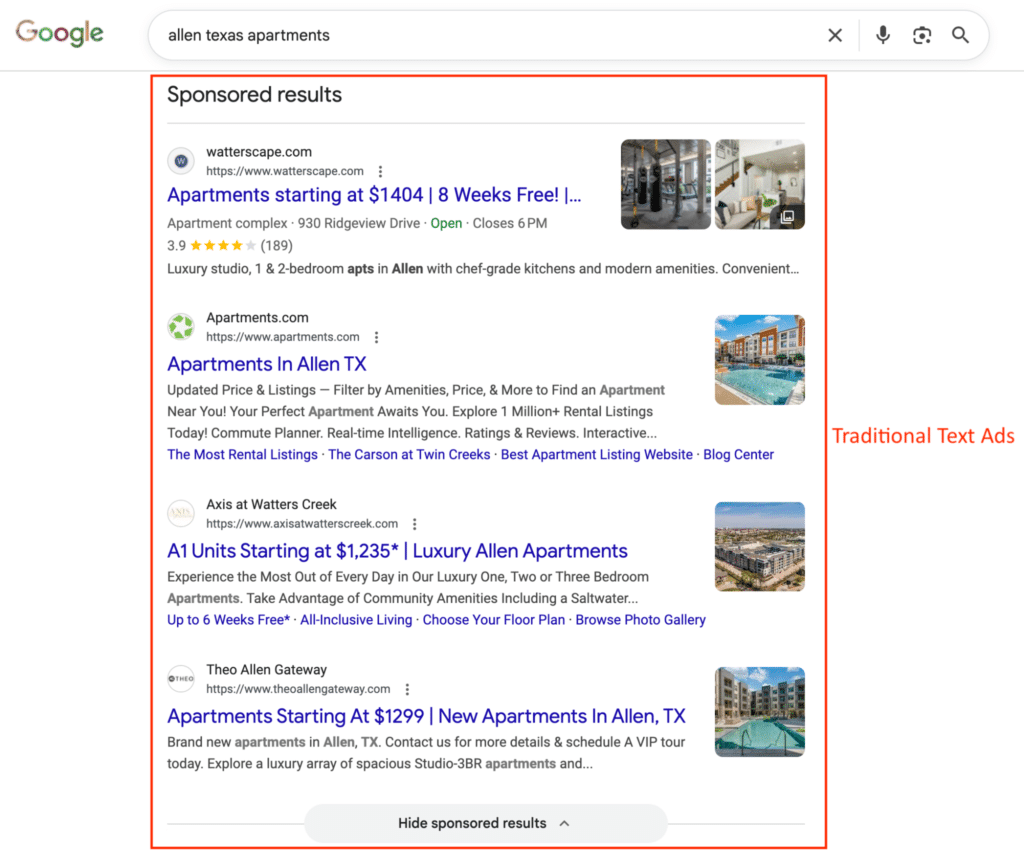
- A lot of user activity is taking place within Google on the search engine results pages – this gives Google the ability to co-opt other business brands and shift monetization to the products it chooses. For many businesses, their brand is their most valuable asset and Google is taking its share. It’s important to track how your brand is being presented in search results and understand what is under your control with ads. Local listings, AI overviews, brand profiles, automated ad formats, and cross network targeting, all shift control over your brand’s presentation to other platforms outside of your website. Performance Max, particularly, allows Google to represent and monetize your brand, so it’s important to monitor. To illustrate this point, here’s an example of a Performance Max ad displaying on a local business listing in Google:
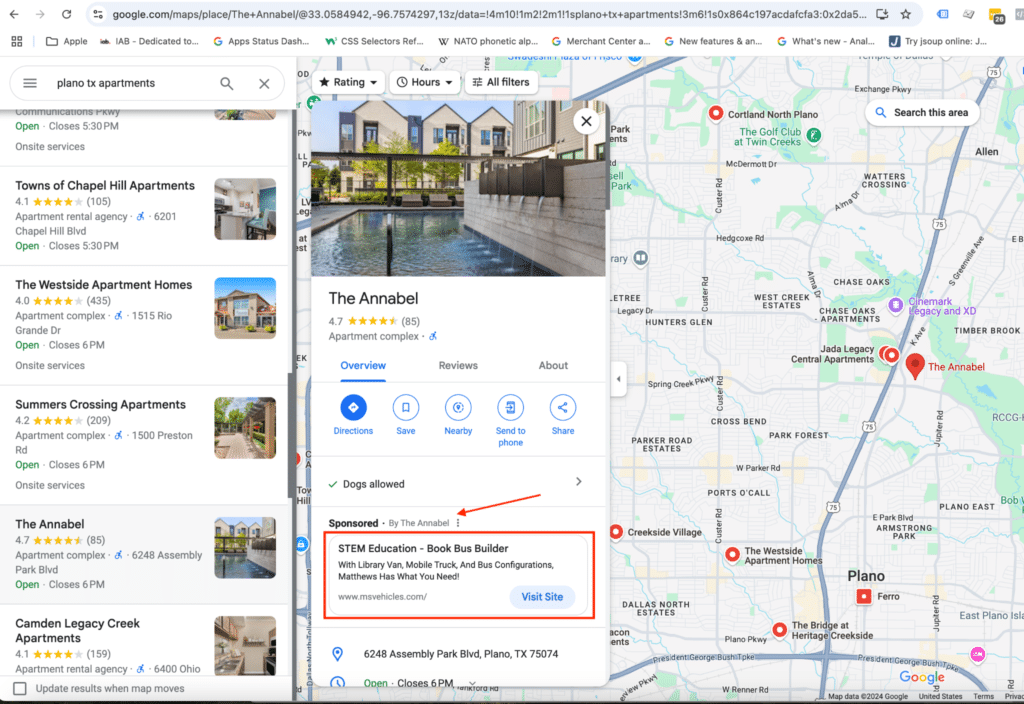
- You’ll notice that the local listing does not link to the business website outside of the ad, where it has a button that says “Visit Site.” Google is driving clicks on the ad by withholding basic organic functionality at the top of the listing; people who want to get to your website are steered to an ad click. Also notice that this ad is an example of a mistake because it’s clear that Google is trying to display an ad for “The Annabel” but has circulated an irrelevant ad for another business that is not promoting apartments. At one point in Google’s history, this ad may have been considered an entirely new ad type that advertisers could opt into and control visibility on separately from regular search ads. Nowadays, this is something you stumble upon incidentally by monitoring how your brand is being represented on Google. You don’t have complete control over its display, but you have options to indirectly manage its presentation with possible compromises to ads in other inventory.
While landing page experiments may have less of an impact on your account’s performance than they did in the past, they are still a key item for optimization. Running a successful experiment means filtering out the clicks that don’t lead to your landing page in order to judge performance.
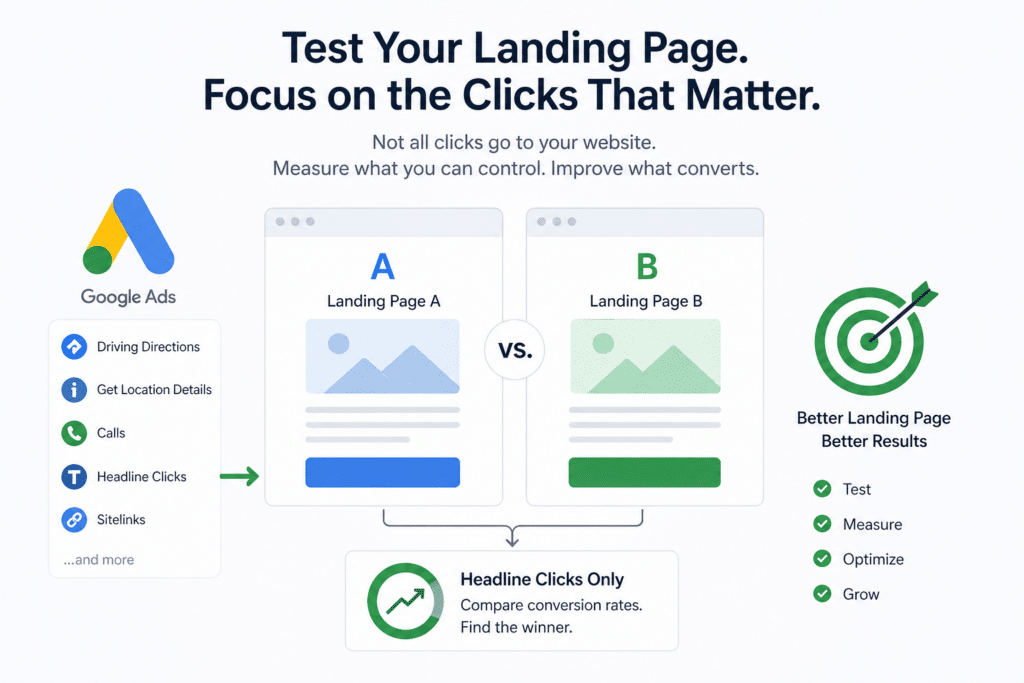
Running a Landing Page Experiment Examining Only Headline Clicks
If you’re running a landing page experiment in an account where most of the clicks don’t necessarily lead to the landing page, you’ll want to judge performance based solely on headline clicks. This way performance isn’t watered down by other click types that have no bearing on the success of your landing page. It will help you identify performance differences sooner. These are the steps for a successful experiment:
- Estimate the amount of traffic you’ll need to get a meaningful result from your experiment using a tool like this one. Typically you are comparing two conversion rates to see if an experiment page is significantly different from a control page. Using a statistical z-test to compare two proportions (conversion rates), here are sample inputs to calculate an estimate of the number of clicks you’ll need to get meaningful results:
Confidence Interval: 90%
Power: 80%
Control page conversion rate (sample proportion of group 1. This is your landing page’s current conversion rate): 6%
Experiment page conversion rate (sample proportion of group 2. This is what you might expect your new landing page’s conversion rate to be. It is a guess.): 7.5%

- This results in a required sample size of 3,457 clicks per group – the treatment group and control group – 6,914 clicks total. In this case, you’ll want to design your experiment so that the search campaigns that are opted in to the A/B test are set to have at least 6,900 headline clicks over a period of 4-6 weeks. It’s possible that your experiment will show statistically significant results before your experiment campaigns have had 6,900 clicks; however, if results are not yet significant when you reach that threshold, you know that your landing pages probably don’t perform differently (i.e. you accept the null hypothesis).
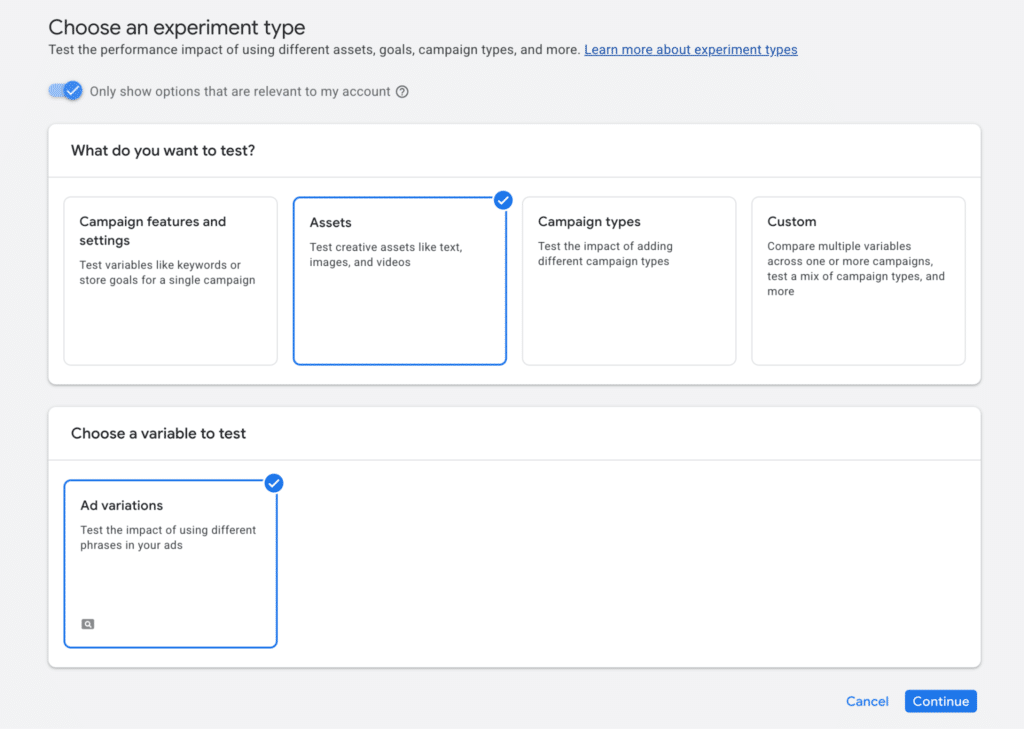
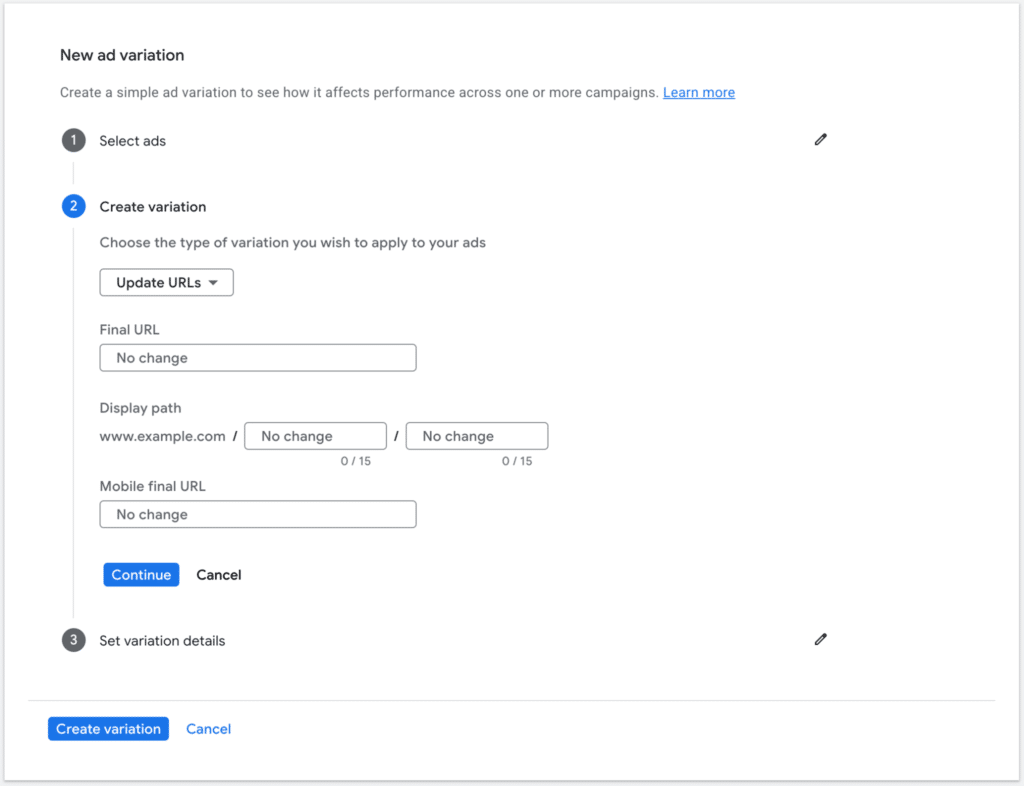
- Create an “Ad Variations” experiment in Google Ads for the campaigns you identified in step 1. Update the final URL for the control ads with your new landing page URL.
- This will split ad impressions between your control landing page and your new experiment landing page.
- After the experiment starts, Google will start reporting results in the “Experiments” section of the Google Ads interface. But these results include all types of clicks, and we’re really only interested in headline clicks. To track performance by headline clicks, use landing page reports, segmented by click type.
- Consider creating a Data Studio dashboard to easily see the data without any manual processing.
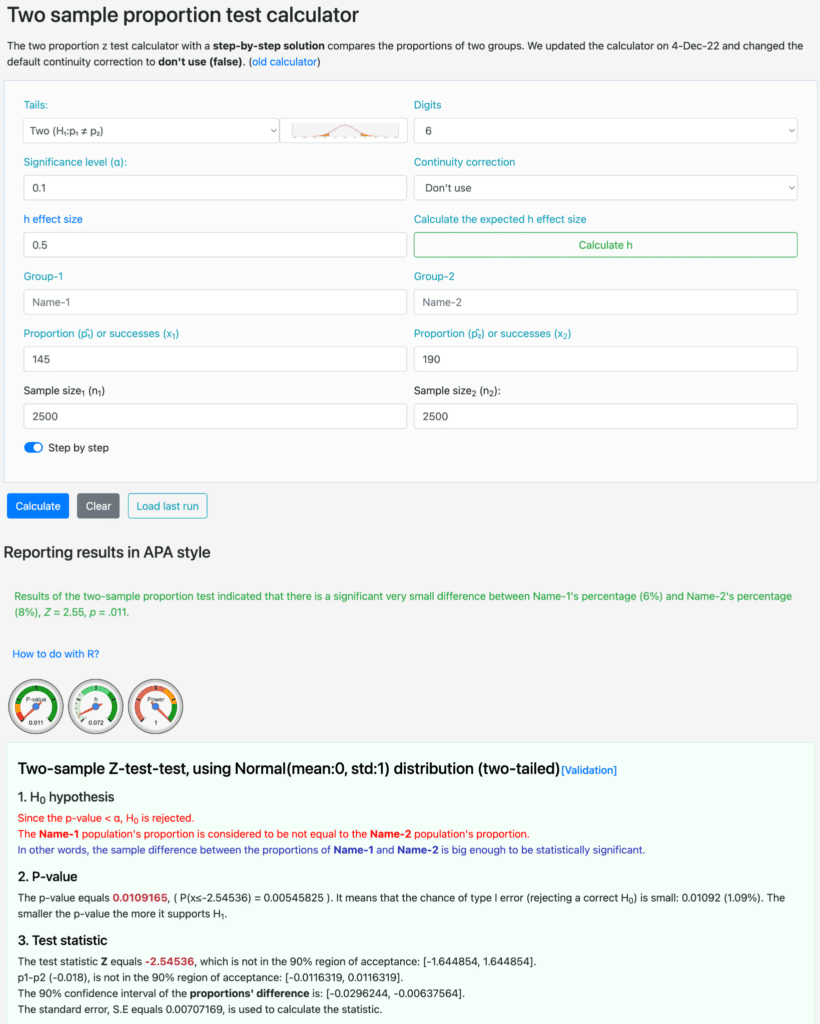
- Determine whether results are statistically significant using a tool like this one. For example, let’s say your experiment has been running for a while, and each landing page has gotten 2,500 headline clicks – i.e. the sample size for group one is 2,500 and the sample size for group two is 2,500. From those clicks, the control page has gotten 145 conversions and the experiment page has gotten 190 conversions. From this, you have a statistically significant result because your p-value is much less than 0.1. Your experiment page is better than your control page!
Click Types and Optimization
Aggregate metrics from search campaigns in Google Ads can hide significant differences in click traffic. Segmenting campaign reports by click type helps reveal disparities impacting your conversion tracking and optimization efforts. Landing pages are still a key focus in these efforts, but as Google drives greater user engagement entirely within its own platform, it is important to properly gauge the effects of testing and modify reporting to focus on the segments that are most relevant.
Landing page optimization remains one of the highest-leverage activities in a well-managed Google Ads account but only if you’re measuring the right clicks. As Google continues to expand its own on-platform engagement through local listings, AI overviews, and automated ad formats, advertisers need to be more deliberate about segmenting their data. Filtering your experiment results down to headline clicks gives you a cleaner signal, faster results, and more confidence in the decisions you make. At Pure Visibility, we help businesses navigate these complexities and build testing frameworks that actually reflect how their campaigns perform. Contact us to learn how we can help you get more out of your Google Ads investment.